I wanted to compare WiFi coverage of two different wireless access points and their various configurations in my house, and also check for dead spots. One quick and cheap way to do this that I have come across is using a free product called Ekahau HeatMapper.
Ekahau HeatMapper allows you to walk around your home or office and capture information about WiFi signals in various spots, and then the software aggregates this information into a banded topographical map.
Pros:
- Free
- Quick to survey home or small office
- Displays heat map and other data for multiple access points, including name, mac address, signal strength, channel, standard, security type, max transfer rate
- Supports 802.11n, as well as a/b/g standards
- Displays
Cons:
- Can not save survey, but can export heat map as image
- No zoom or panning controls
- 2D only, take separate surveys for multiple floors
- Not good for complex wireless network analysis
What you will need:
- Laptop with WiFi; to move through your house and capture WiFi data.
- Software: http://www.ekahau.com/wifidesign/ekahau-heatmapper
- Floor Plan (Optional and recommended)
Tutorial:
- Install and then launch software.
- When the program loads, look for the section on the right that says “Do you have a map?”. Select the appropriate option.
- Left-Click your current starting location.
- Move around the space and continue to left-click on your location each time you want to take a measurement.
- When you have finished taking measurements then right-click anywhere on the map to end the survey.
Results:
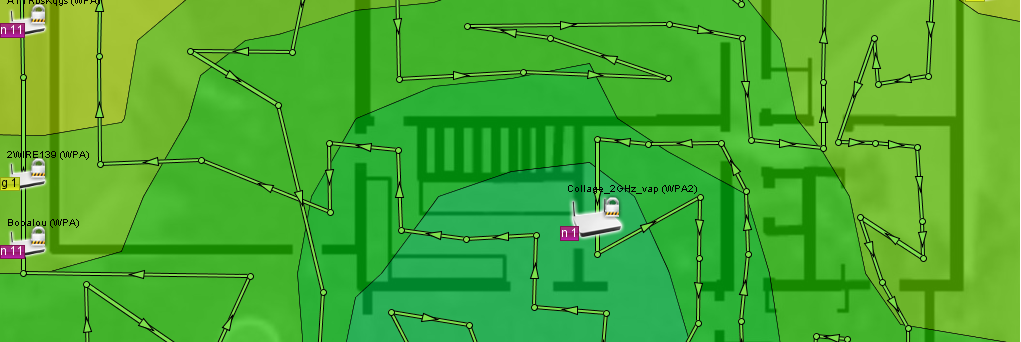
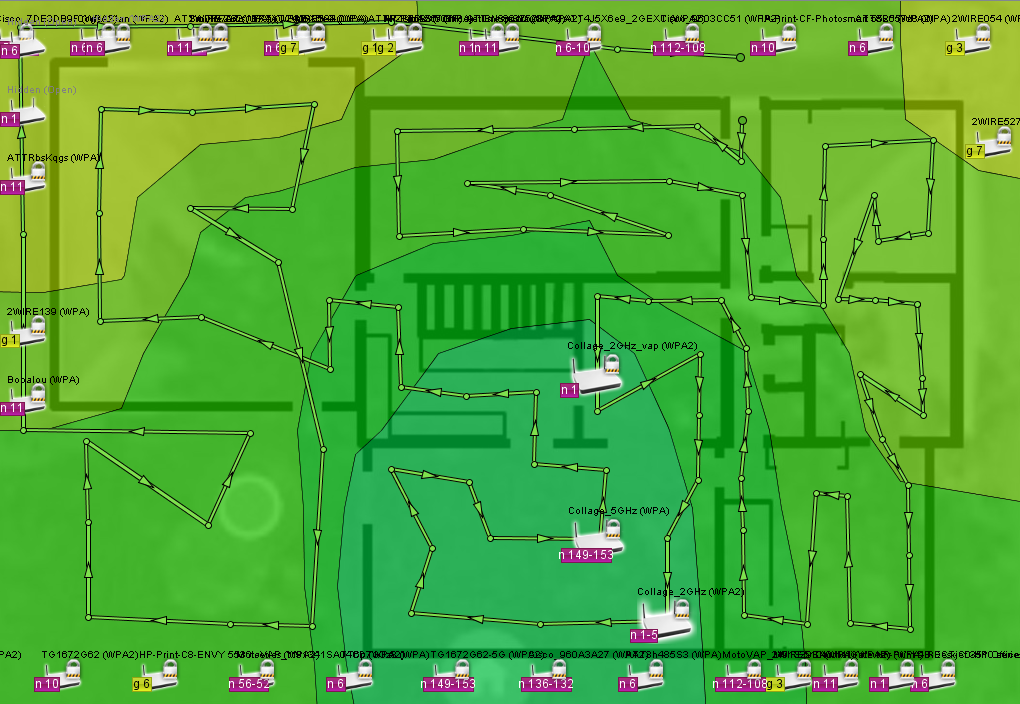
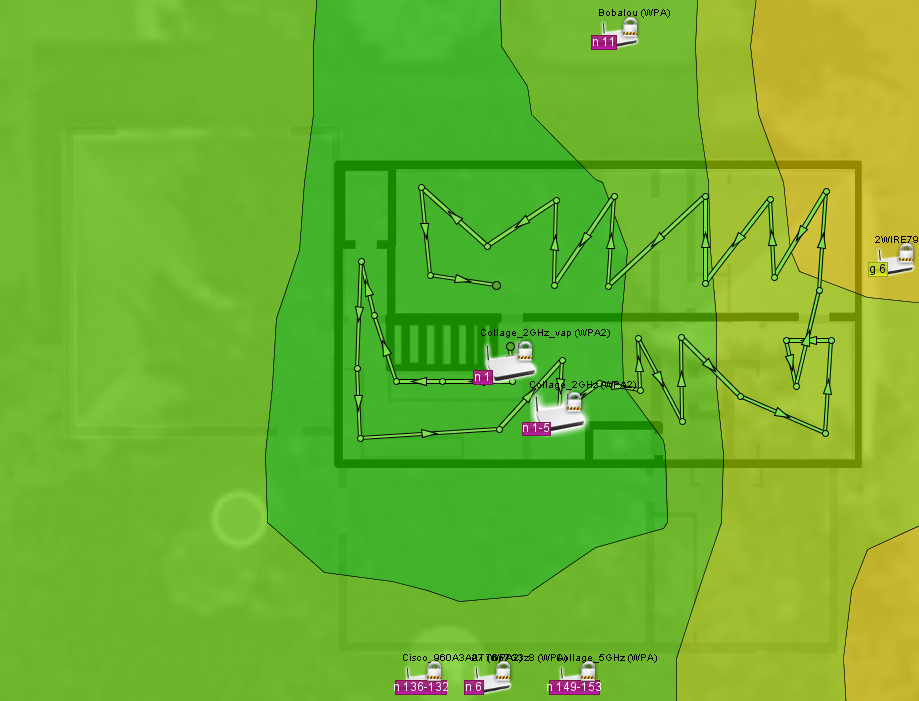
The images below are for Access Point “Collage 2GHz”, which is in my living room on the main level. This shows how weak the signals are in the corners of the house and in the basement.
The heat map groups the dBm measurements into 9 strength bands. The values are basically the amount of dBm loss from the source. The full signal would be zero, and any loss would be shown as a negative value.
- Good: ■0 to -35, ■-35 to -40, ■-40 to -48
- Mid: ■-48 to -56, ■-56 to -64, ■-64 to -72
- Bad: ■-72 to -80, ■-80 to -88, ■-88 to -95
Comments/Tips:
- If you do not have access to floor plans, draw your own. I took a screen capture of an overhead view of my house in google maps. I then open this in paint and roughly drew in where the walls are.
- The results will depend on the accuracy of your floor plan and accuracy of the position of your survey clicks.
- The more measurements you take the better.
- The default view shows the combined coverage of all access points. Hover over and access point to view its coverage.
- Access Points will often not show exactly in the right position, but the software does its best with the data you provide.
Bottom Line:
If you need an easy and free way to get visibility into your home or small office WiFi coverage then Ekahau HeatMapper will do that for you. If you require complex and multi-level (3d) analysis then you will likely need to purchase some professional software, which Ekahau actually does offer, among other companies.
![Jon Culp [.com]](https://jonculp.com/wp-content/uploads/2017/11/phoenix_wjon3.jpg)


Thanks for article. It’s easy and interesting to read. This Wi-Fi survey thing is pretty interesting to do. But unfortunately I only have Mac and not able to use HeatMaper. But I can use similar soft , give you a link mb it can help you or your friend with Mac =) http://www.netspotapp.com/
Thanks for contributing. Does it work on windows or mobile? I’d like to try it out.
Yep, they released Windows version recently: http://www.netspotapp.com/netspot-windows.html .